The structure and composition of plant communities in drylands are highly variable across scales, from microsites to landscapes. Fine spatial resolution field surveys of dryland plants are essential to unravel the impact of climate change; however, traditional field data collection is challenging considering sampling efforts and costs. Unoccupied aerial systems (UAS) can alleviate this challenge by providing standardized measurements of plant community attributes with high resolution. However, given widespread heterogeneity in plant communities in drylands, and especially across environmental gradients, the transferability of UAS imagery protocols is unclear. Plant functional types (PFTs) are a classification scheme that aggregates the diversity of plant structure and function. We mapped and modeled PFTs and fractional photosynthetic cover using the same UAS imagery protocol across three dryland communities, differentiated by a landscape-scale gradient of elevation and precipitation. We compared the accuracy of the UAS products between the three dryland sites. PFT classifications and modeled photosynthetic cover had highest accuracies at higher elevations (2241 m) with denser vegetation. The lowest site (1101 m), with more bare ground, had the least agreement with the field data. Notably, shrub cover was well predicted across the gradient of elevation and precipitation (~230–1100 mm/year). UAS surveys captured the heterogeneity of plant cover across sites and presented options to measure leaf-level composition and structure at landscape levels. Our results demonstrate that some PFTs (i.e., shrubs) can readily be detected across sites using the same UAS imagery protocols, while others (i.e., grasses) may require site-specific flight protocols for best accuracy. As UAS are increasingly used to monitor dryland vegetation, developing protocols that maximize information and efficiency is a research and management priority.
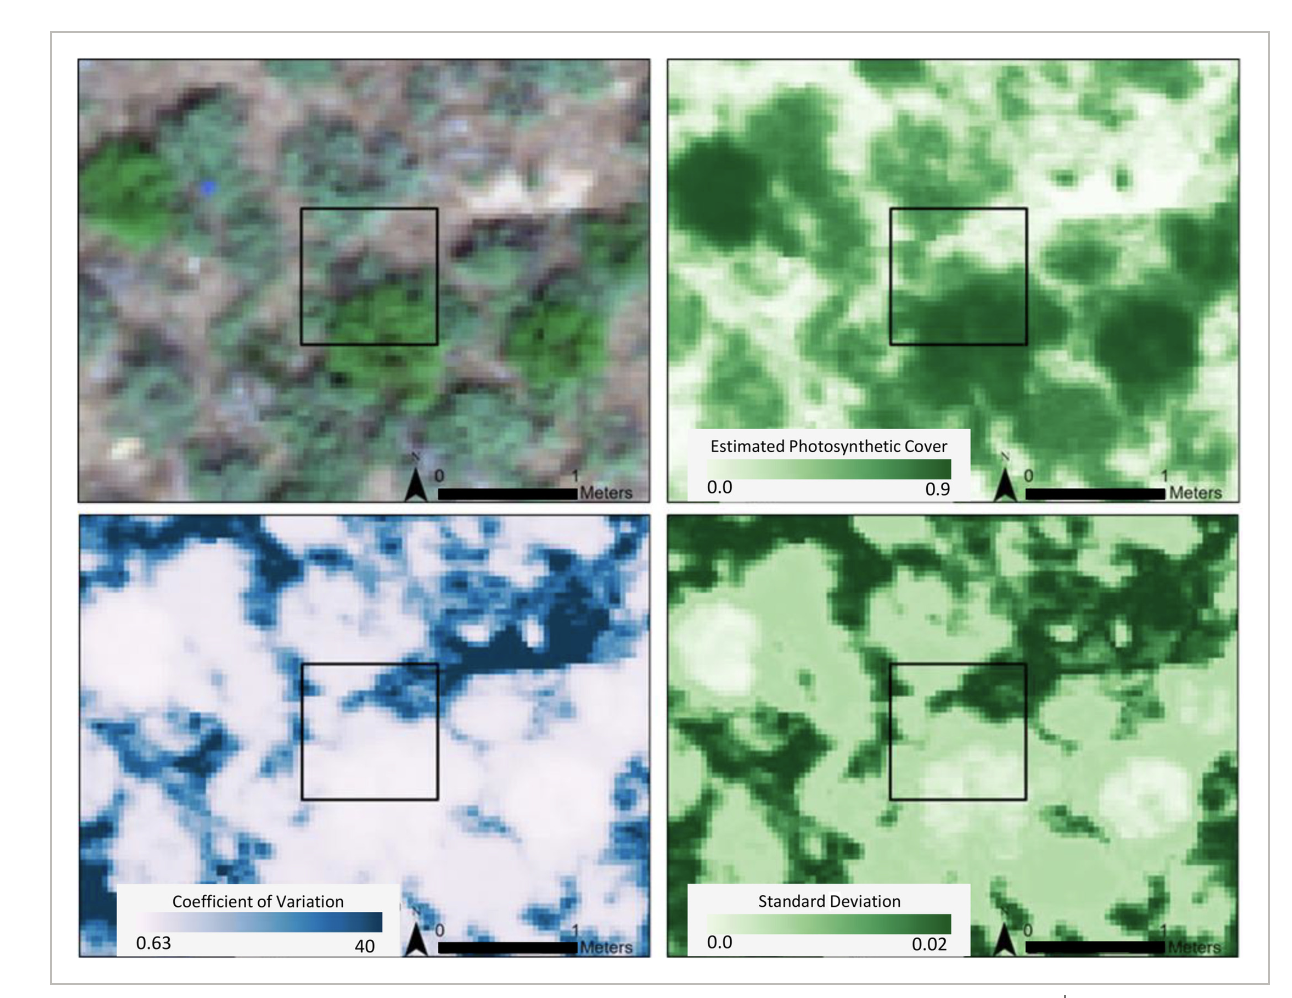
Example of the variability of the model to map fractional photosynthetic cover at 1-m2 scale (black box) at a Middle site plot. Clockwise from the top left: true color, estimated photosynthetic cover, standard deviation of photosynthetic cover, and coefficient of variation of photosynthetic cover. Darker pixels represent higher values. The highest values of variation are pixels over heterogeneous and bare soil cover types.
| GEM3 author(s) | |
| Year published |
2022
|
| Journal |
Ecosphere
|
| DOI/URL | |
| Keywords |
Ecology
GIS & Remote Sensing
Landscapes
Sagebrush
|
| GEM3 component |
Mapping
Modeling
|
| Mentions grant |
Yes
|