In recent decades, wildfires in many areas of the United States (U.S.) have become larger and more frequent with increasing anthropogenic pressure, including interactions between climate, land-use change, and human ignitions. We aimed to characterize the spatiotemporal patterns of contemporary fire characteristics across the contiguous United States (CONUS). We derived fire variables based on frequency, fire radiative power (FRP), event size, burned area, and season length from satellite-derived fire products and a government records database on a 50 km grid (1984–2020). We used k-means clustering to create a hierarchical classification scheme of areas with relatively homogeneous fire characteristics, or modern ‘pyromes,’ and report on the model with eight major pyromes. Human ignition pressure provides a key explanation for the East-West patterns of fire characteristics. Human-dominated pyromes (85% mean anthropogenic ignitions), with moderate fire size, area burned, and intensity, covered 59% of CONUS, primarily in the East and East Central. Physically dominated pyromes (47% mean anthropogenic ignitions) characterized by relatively large (average 439 mean annual ha per 50 km pixel) and intense (average 75 mean annual megawatts/pixel) fires occurred in 14% of CONUS, primarily in the West and West Central. The percent of anthropogenic ignitions increased over time in all pyromes (0.5–1.7% annually). Higher fire frequency was related to smaller events and lower FRP, and these relationships were moderated by vegetation, climate, and ignition type. Notably, a spatial mismatch between our derived modern pyromes and both ecoregions and historical fire regimes suggests other major drivers for modern U.S. fire patterns than vegetation-based classification systems. This effort to delineate modern U.S. pyromes based on fire observations provides a national-scale framework of contemporary fire regions and may help elucidate patterns of change in an uncertain future.
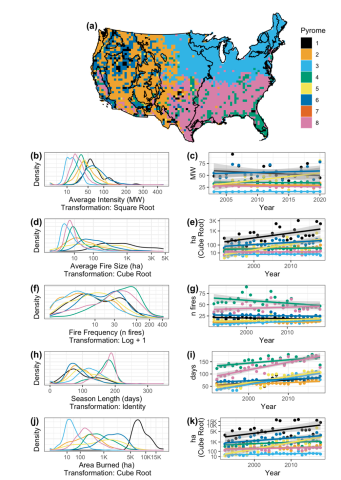
Pyrome classification scheme for k = 8 in the contiguous U.S. (a) The pyrome map with Environmental Protection Agency (EPA) Level 1 ecoregions displayed as black outlines. For each pyrome, the distributions and temporal trends are shown for the following characteristics (pyrome 7 was excluded due to insufficient sample size): (b,c) fire intensity (mean fire radiative power (FRP) from the Moderate Resolution Imaging Spectroradiometer (MODIS) in megawatts (MW)); (d,e) fire event size (mean area from the Fire Program Analysis fire-occurrence database (FPA-FOD) in hectares (ha); (f,g) frequency (number of fires from the FPA-FOD); (h,i) season length (2*sd Julian day from the FPA-FOD in days); and (j,k) burned area (sum area from the FPA-FOD in ha). All values are annual pixel means for each pyrome. For change over time, dots represent the average value for each year for each pyrome, and the trend lines (with error) were determined with linear regression. Black lines on the maps represent EPA Level 1 ecoregions.
| GEM3 author(s) | |
| Year published |
2022
|
| Journal |
fire
|
| DOI/URL | |
| Keywords |
Ecology
Geography
Socio-Ecological Systems
GIS & Remote Sensing
Mathematical Models
Human Dimensions
Landscapes
|
| GEM3 component |
Mapping
|
| Mentions grant |
Yes
|

